Navigating the Dashboard
Understand the dashboard layout, sidebar navigation, and key sections of OpenRails
Overview
The OpenRails dashboard is your central hub for managing bots, agents, data lakes, evaluations, connectors, and tools. It provides real-time statistics, metrics, and live notifications.
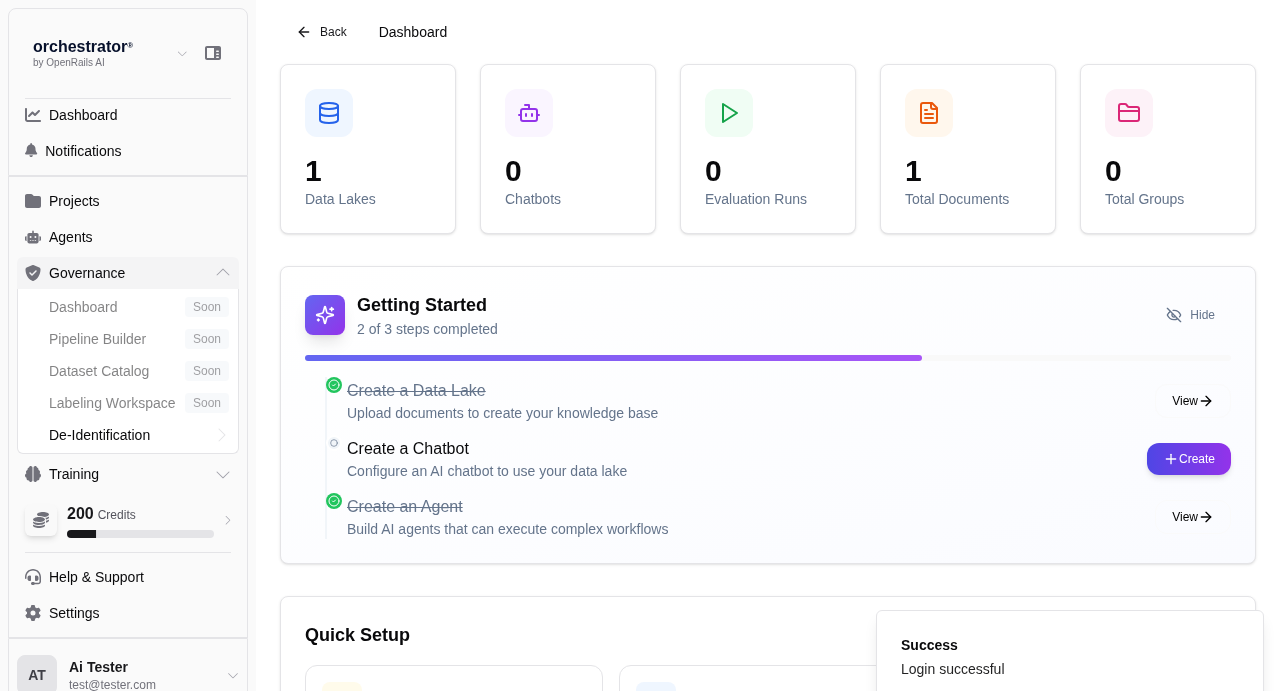
Dashboard Layout
Top Navigation Bar
The fixed top bar contains the OpenRails logo, a global search field, notification bell (real-time updates), and your profile menu. Use the search to quickly find bots, agents, or documents across all your projects.
Sidebar Navigation
The left sidebar provides access to all major sections. It collapses on smaller screens and can be toggled with the hamburger menu. Sections include:
- Dashboard — Overview statistics and recent activity
- Bots — Chat bots and conversation management
- Agents — Agent creation, templates, symphonies, and playbooks
- Data Lakes — Document storage, collections, and RAG configuration
- Evaluations — Test case management and evaluation runs
- Connectors — External service integrations (Basecamp, Azure DevOps)
- Tools — MCP servers, web crawlers, and utility tools
Main Content Area
The central panel displays the content for the currently selected section. It typically includes a list or grid view of items, a detail panel, and action buttons.
Statistics Cards
The dashboard home shows summary cards with key metrics: total conversations, active agents, documents processed, and evaluation pass rates. These update in real time.
Sidebar Sections Reference
| Section | Description | Key Actions |
|---|---|---|
| Bots | Manage chat bots and conversations | Create bot, start conversation, view history |
| Agents | Create and run autonomous agents | Create agent, assign tools, execute runs |
| Data Lakes | Document storage and vector collections | Upload documents, configure collections, manage permissions |
| Evaluations | Test cases and automated evaluation runs | Author test cases, run evaluations, review results |
| Connectors | Third-party service integrations | Configure credentials, sync documents, set up routes |
| Tools | MCP servers, crawlers, and utilities | Connect MCP servers, run crawlers, manage tool catalog |
Real-Time Notifications
OpenRails pushes real-time notifications to your dashboard via live updates. You will receive alerts for:
- Agent run completions and failures
- Document ingestion progress and errors
- Evaluation run results
- HITL approval requests from agents
- Connector sync status changes